How BODEX built a Custom Dashboard for KPIs (Key Performance Indicators)
Problem Statement
We were approached by a client who was using spreadsheets and email chains for gathering and maintaining the raw data coming from different business units associated with them. The leadership in the company was looking at raw numbers to make executive decisions. The absence of a visual dashboard was directly affecting the decision making in the company.

Solution
We understood the problem and proactively suggested this solution. We designed and developed a cloud-based platform agnostic software application called KPI-Dashboard, which helps in visually tracking the real time data and also allows for building custom reports.

Technically it has 2 main parts:
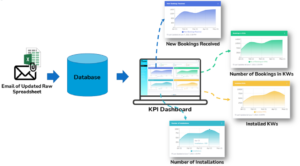
Firstly, it has an automated backend process engine which imports the raw data from spreadsheets into the application database. This not only provides centralized storage but also helps to manage and easily search for the data, when previously searching in spreadsheets was a time-consuming job for the client.
Secondly, based on this raw data, the KPI Dashboard helps in visualizing the overall performance as well as per business units with graphs.
It provides:
- Visualization and Analysis of Data
- Overall Year to Date data
- Yearly, monthly, and weekly data visualization.
- Visualizing data in tabular format.


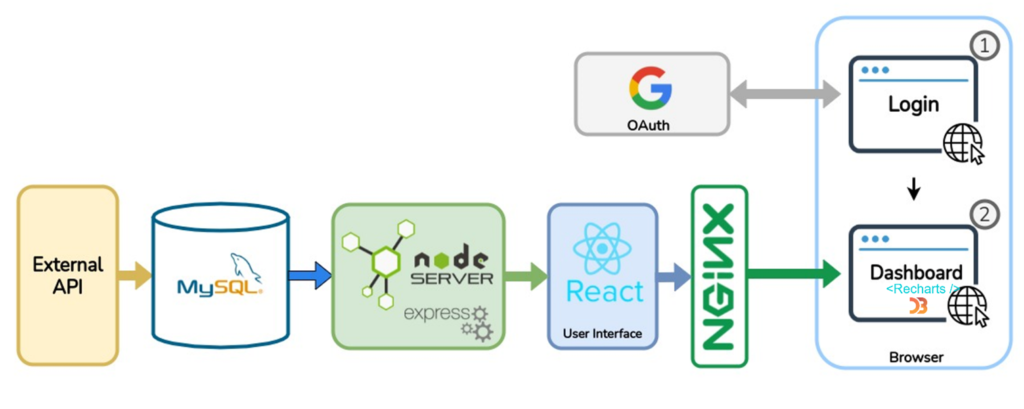
Technology Stack Utilized

Outcome
Among the main benefits of using this app, our happy client saw the following:
- Dashboards Align with Goals.
- Efficient decision-making.
- Measurable and trackable outcomes and results.
- Made reporting of KPIs more visible.
- Increased efficiency by analyzing performance.
Download
Other Case Studies

Have a similar problem?
If you have a similar problem on which we can help you, give BODEX a chance to solve it. We will apply our proprietary methodology to make sure your business works to your specifications and satisfaction.
